Statistics is fundamentally an applied field. The methods and algorithms we study — MCMC, variational inference, hidden Markov models, generative models — can help scientists and practitioners reason rigorously about real-world phenomena. This course is organized around an extended research project in which you apply these methods to a real problem of your choosing. The project is designed to simulate the experience of doing real applied statistics research. The goal is not to produce a publishable paper or a state-of-the-art result — it is to practice the full craft of applied statistics with honesty, rigor, and curiosity.
You will follow the iterative cycle known as Box’s Loop:
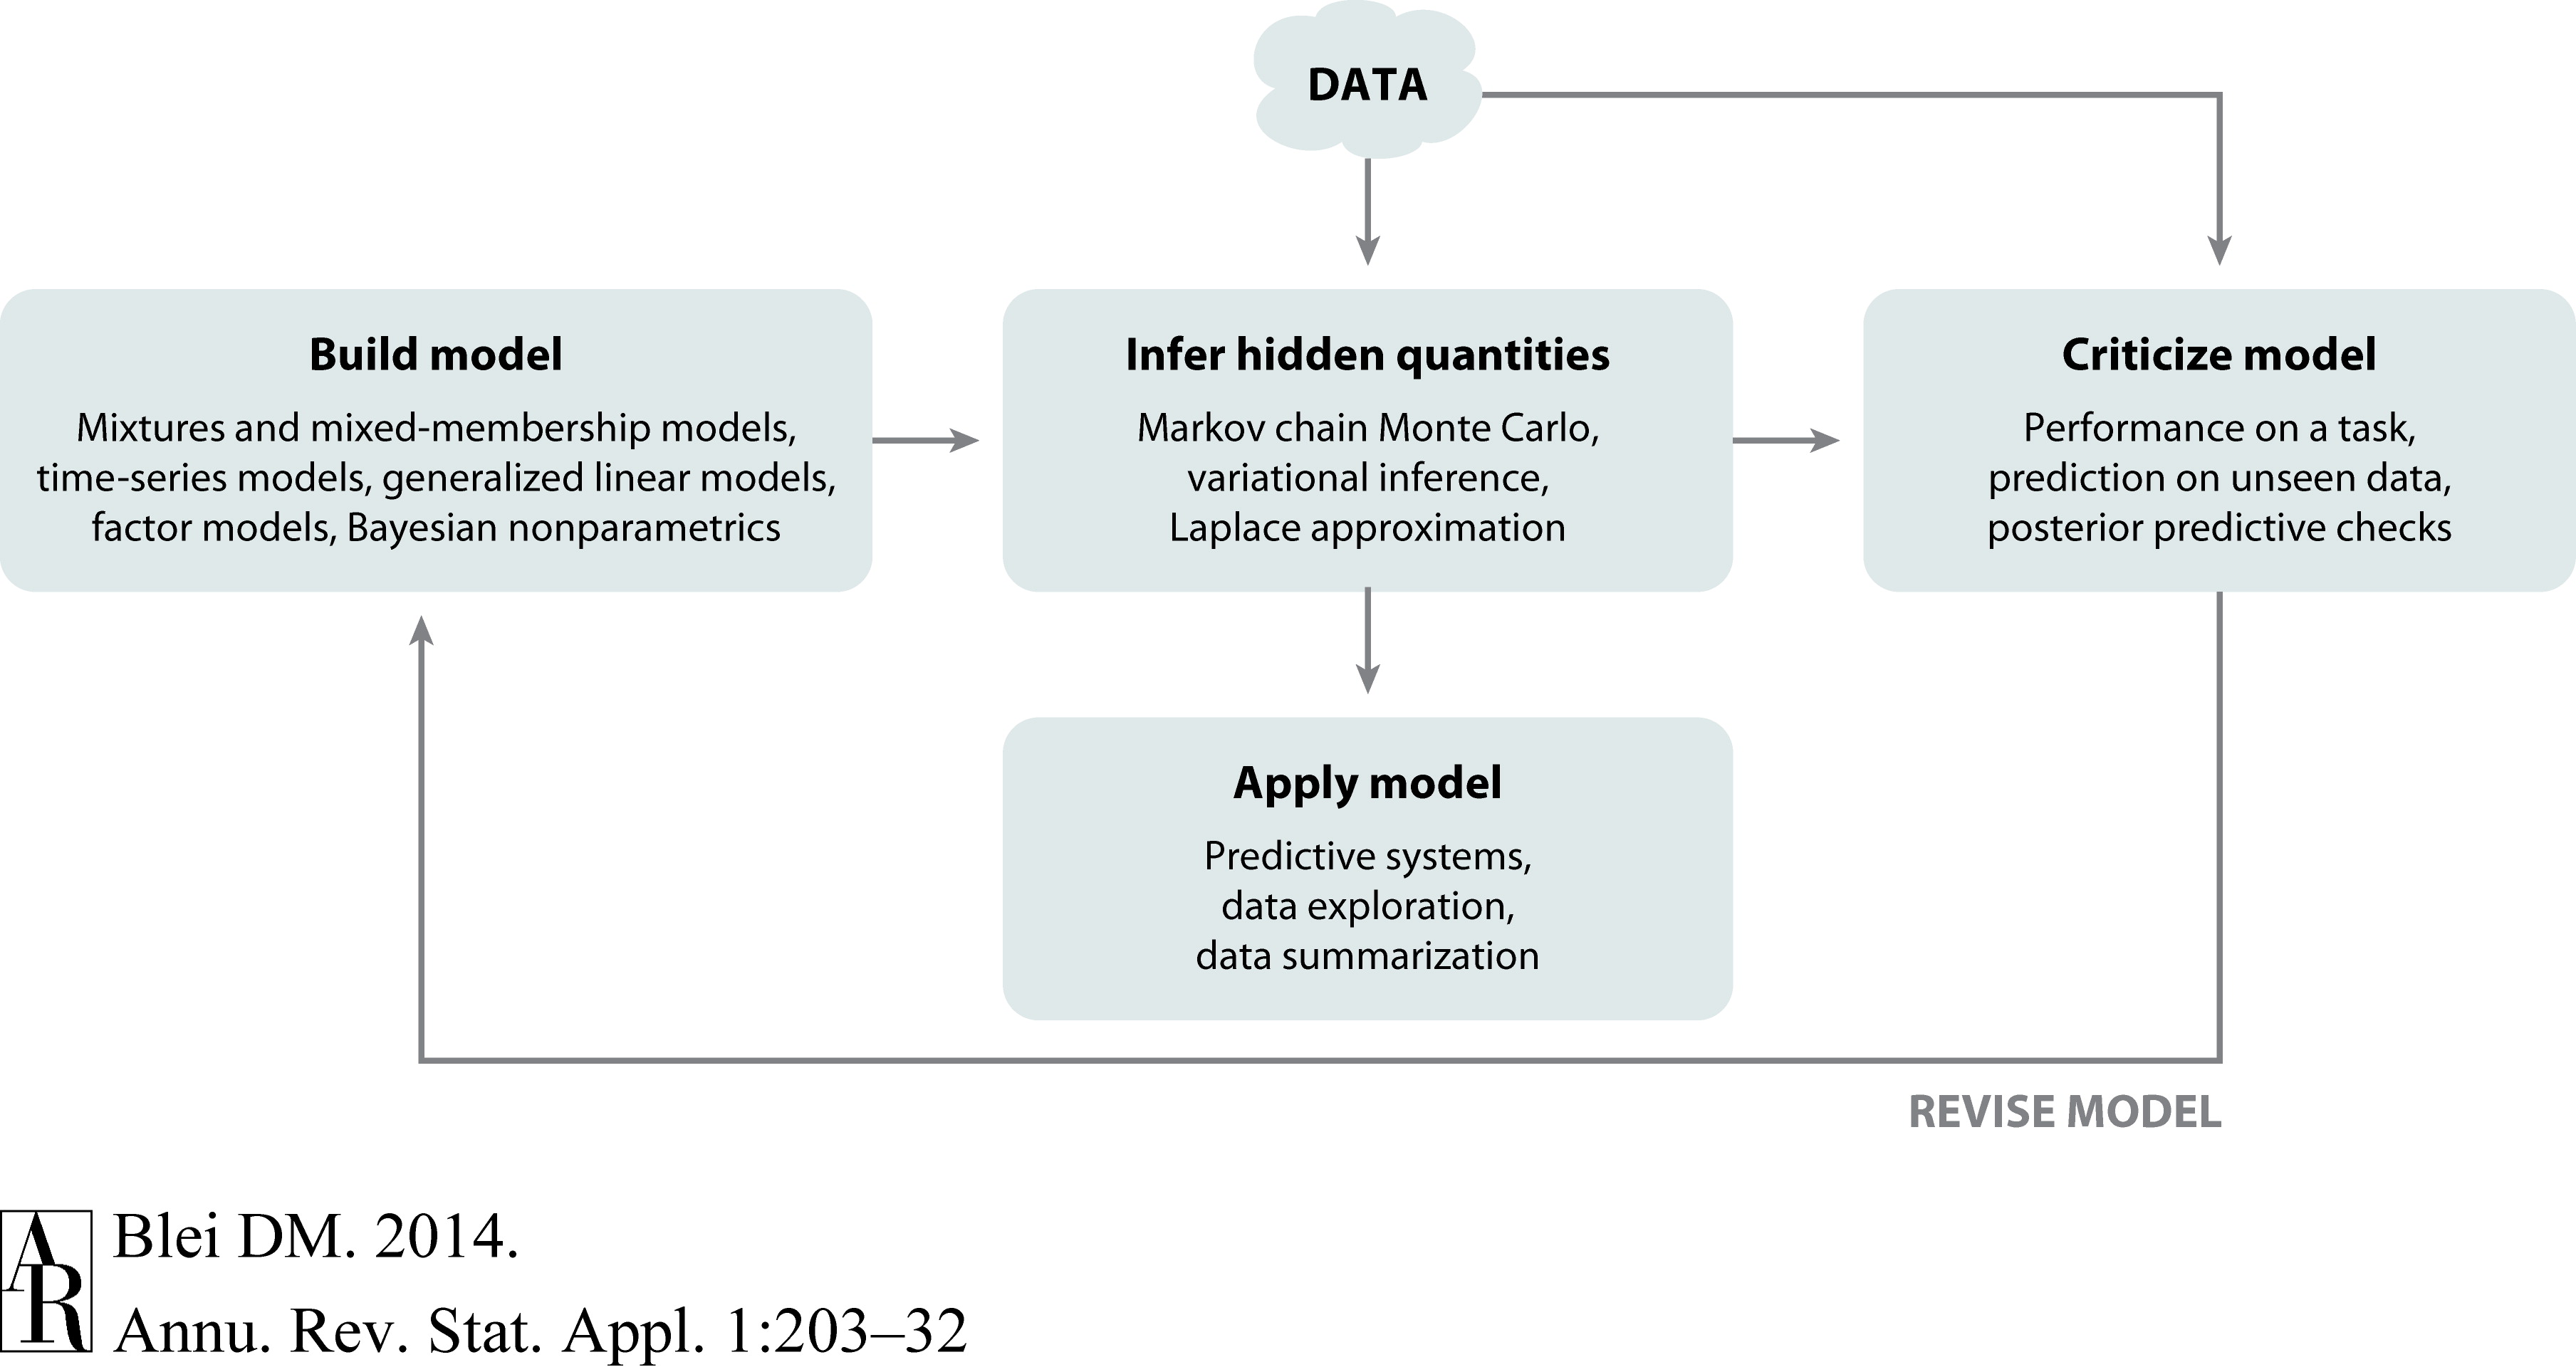
Figure 1:Box’s loop: the iterative cycle of model building, inference, and criticism. Figure from Blei, 2014.
There are four milestones throughout the quarter, each corresponding to one stage of the loop. After each milestone, your team presents a one-slide summary at a lab meeting, which will take place during the class period. The quarter culminates in an 8-page research paper in the AISTATS format.
Teams
You are required to work in teams of two — collaboration is a key component of applied statistics, and it takes practice. You should find your partner in Week 1. If your partner drops the course, we will help you find a new partner.
Choosing a Problem
The most important — and most difficult — part of the project is choosing a good problem. A good project problem has the following properties:
Real and important. The problem matters to some community (scientific, social, clinical, economic). You should be able to articulate clearly why someone would care about the answer.
Data-driven. There is real data available, or you can collect it. The data should be rich enough that simple inspection cannot answer your question on its own.
Tractable for probabilistic modeling. Uncertainty is intrinsic to the problem, and a probabilistic model adds genuine value. Bayesian inference, latent variables, or hierarchical structure should be a natural fit.
Appropriately scoped. It is better to do one thing deeply than many things superficially. A focused analysis of a well-chosen dataset will score higher than an ambitious but shallow survey.
You do not need to invent a new problem. You may:
Apply course methods to a dataset from your own research.
Replicate and significantly extend a published applied study.
Explore a publicly available dataset on a topic you care about.
If you replicate an existing paper, you must go beyond simple replication — probe the assumptions, compare alternative models, or extend the analysis in a meaningful direction.
What to avoid. Methods for the sake of methods. (“A comparison of five VI algorithms on synthetic data” is not an acceptable course project.) The project must be grounded in a real applied problem. If you need to develop new methods to solve that problem, great! But the best methodological research always stems from a real world problem.
Milestones
There are four milestones, due roughly every two weeks on Sunday at 11:59 pm. Each is a short written report (1–2 pages) that advances your project by one stage of Box’s Loop. Milestones are cumulative: each builds directly on the previous. You will present the deliverable for each milestone in the Lab Meeting the week after the due date (see below).
Milestone 1 — Problem Formulation (Week 2)
Corresponding to: “Formulate a problem” This milestone will be completed individually.
Describe the problem you propose to study:
Scientific or applied question. What are you trying to answer, and why does it matter?
Data source. What data exists? Include a brief description of the format, size, and any known quality issues.
Statistical framing. How can probabilistic modeling help? What are the key sources of uncertainty? What would a reasonable model look like at a high level?
Related work. Cite 2–3 relevant papers or analyses. If you are building on an existing paper, identify it here.
Deliverable: A 1 page report (your AI disclosure and references may go on page 2) and a 1-slide (2 minute) pitch delivered in lab meeting during Week 2.
Next step. After presenting your pitch and hearing others’, you will find a partner to work with for the rest of the course. You and your teammate will refine the problem statement and begin working towards Milestone 2.
Milestone 2 — Data and Exploratory Analysis (Week 4) This milestone will be completed by each team of two.
Corresponding to: “Collect data”
Obtain and explore your data:
Data description. Document the provenance, format, and preprocessing steps. Include summary statistics and any data cleaning decisions.
Exploratory analysis. Visualize the data. Describe patterns, anomalies, and distributional properties. What do you observe? What remains unexplained?
Refined model sketch. Based on your EDA, sharpen your description of the model you plan to build. What distributional assumptions seem reasonable? What latent structure might be present?
Deliverable: A 2 page report with your most important figures, and a link to your public GitHub repository. Your repository should have several commits documenting your progress over this two-week period, including the Jupyter notebooks used to perform the analyses.
Milestone 3 — Model and Inference (Week 6)
Corresponding to: “Build a model” and “Perform inference” This milestone will be completed by each team of two.
Implement a probabilistic model and fit it to your data:
Model specification. Write out the full generative model (prior and likelihood). Justify your choices.
Inference algorithm. Implement at least one inference method covered in the course (MCMC, VI, EM, etc.). Justify your choice and report convergence diagnostics.
Posterior analysis. Summarize and visualize the posterior. What do the results tell you about your problem?
Baseline comparison. Compare your probabilistic model to a simpler baseline. Does the added complexity help? Be honest.
Deliverable: A 2 page report with your most important figures. Your GitHub repository should have several commits documenting your progress, including the code and notebooks used to generate your results.
Milestone 4 — Criticism and Revision (Week 8)
Corresponding to: “Criticize the model” and “Revise” This milestone will be completed by each team of two.
Critically evaluate and improve your model:
Posterior predictive checks. Does the model generate data that looks like your real data? Identify specific failures.
Sensitivity analysis. How sensitive are your conclusions to prior choices or modeling assumptions?
Revision. Make at least one substantive improvement motivated by your criticism — a revised likelihood, a different prior, an alternative algorithm, or a different model family.
Comparison. Report results for both the original and revised models. Which is better, and by what criterion?
Deliverable: A 2 page report with your most important figures. Your GitHub repository should have several commits documenting your progress, including the code and notebooks used to generate your results.
Lab Meetings
In the weeks following each milestone submission, the class periods will be devoted to lab meetings — flipped-classroom sessions that simulate the rhythm of a real research group. The class is split into two groups (Monday and Wednesday teams); you will be assigned to one group and should attend only your assigned meeting. The lab meeting format is as follows.
For Milestone 1, each individual will present their pitch with 1 slide, maximum 2 minutes, with 2 minutes for discussion after.
For Milestones 2-4:
Each team presents one slide (≈ 3 minutes) summarizing their milestone: what they did, what they found, and what questions or problems they encountered.
Your peers give feedback (≈ 5 minutes) asking questions, suggesting ideas, and pointing out potential issues.
The teaching staff will facilitate the discussion.
Participation in lab meetings is a major component of your grade. This includes both presenting clearly and engaging substantively with other teams’ work.
Final Report
The final report is due on the same day our final would usually be held. It is an 8-page research paper written in the AISTATS format, as if you were submitting to a machine learning conference. It should synthesize all four milestones into a coherent, self-contained document.
Required sections:
Introduction. Motivate the problem and summarize your findings.
Data. Describe your dataset and key results from your exploratory analysis.
Model. Specify your probabilistic model and justify your choices.
Inference. Describe your inference algorithm and report diagnostics.
Results. Summarize and interpret the posterior. Address your scientific question.
Discussion. Reflect on what worked, what didn’t, and what you would do differently. Be honest about limitations.
Responsible AI Use (if applicable). See AI policy below.
Code must be in a public GitHub repository linked from the report. The commit history should reflect iterative development throughout the quarter — a repository with a single commit made the night before the deadline is a red flag.
Length: 8 pages, excluding references. Appendices are not allowed.
AI Use Policy
The use of LLMs and AI coding assistants (ChatGPT, Claude, GitHub Copilot, etc.) is permitted and in some cases encouraged. These tools can accelerate data processing, help debug code, suggest modeling approaches, and assist with writing. Learning to use AI effectively is itself a valuable skill.
However, the scientific judgment must be yours: choosing a meaningful question, deciding what data is appropriate, evaluating whether a model makes sense, and interpreting what your results actually mean. The lab meetings exist precisely to surface this distinction — shallow AI-generated analysis tends to fall apart under questioning.
If you use AI tools, your final report must include a Responsible AI Use section describing:
What you used it for. Be specific (e.g., “used Claude to generate boilerplate PyTorch code for the HMC sampler”).
How you verified the outputs. What sanity checks did you perform? Did the code run correctly? Did the modeling suggestions make sense given your data?
What the AI got wrong or missed. Honest reflection on failures demonstrates that you were engaged, not passive.
The responsible use section is not a confession; it is evidence of critical thinking.
Getting Started
A few suggestions for choosing a good problem:
Look at papers you already find interesting. If you are in a research group, talk to your advisor about available datasets and open questions. If not, browse recent issues of journals in a field you care about (neuroscience, economics, epidemiology, ecology) and look for studies that used statistical methods.
Prioritize real data over synthetic. Simulated data can be incredibly useful for validating your methods but it removes the messiness that makes applied statistics interesting and difficult. Start with real data, then use simulated data to isolate and test specific aspects of your model and algorithm.
Scope down early. A narrowly focused analysis of one dataset is better than a broad comparison across many.
The answer can be “the simple method works fine.” Some of the most useful applied statistics papers conclude that a simple model fits the data well and complex extensions are not warranted. That is a valid and valuable conclusion.
If you are stuck, the teaching staff will help you brainstorm during office hours in the first few weeks. Come with a general domain in mind and we will work from there.
- Blei, D. M. (2014). Build, Compute, Critique, Repeat: Data Analysis with Latent Variable Models. Annual Review of Statistics and Its Application, 1, 203–232.